In today’s data-driven world, organizations demand agile, scalable, and cost-efficient analytics platforms. If you’re struggling with high Tableau costs and complex SAP HANA infrastructure, you’re not alone. This data migration guide will walk you through transitioning to a modern stack using Google BigQuery for warehousing and Power BI for visualization — with a step-by-step plan, visual diagrams, and best practices.
This guide will walk you through migrating your architecture from SAP HANA + Tableau to SAP HANA + BigQuery + Power BI, including a visual diagram and best practices.
Data Migration Overview
Old Architecture
- Data Source: SAP HANA
- Visualization: Tableau
New Architecture
- Data Source: SAP HANA
- Data Warehouse: Google BigQuery (centralized, scalable)
- Visualization: Microsoft Power BI (cost-effective, interactive)
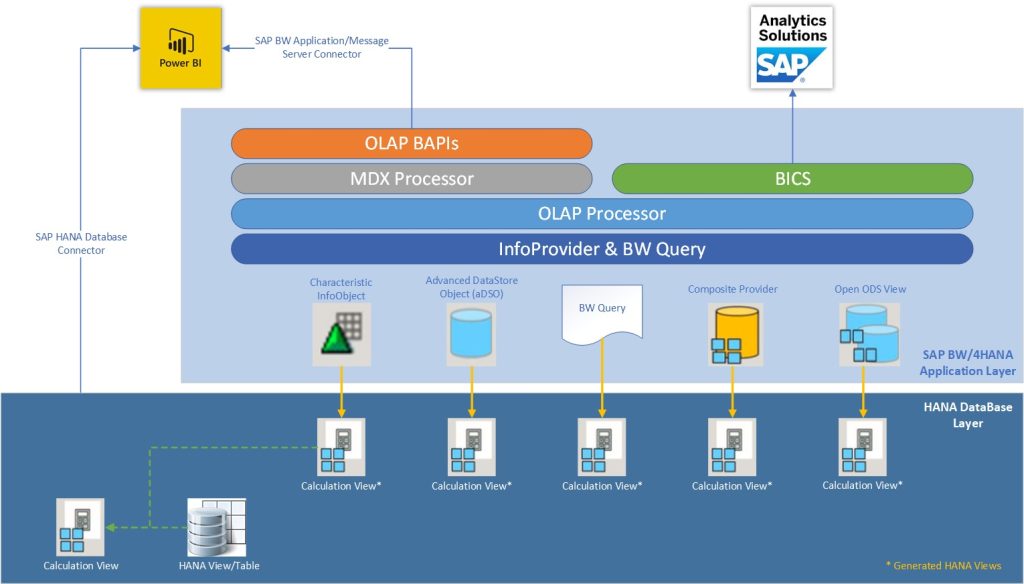
Here’s a visual representation of the transition:
Step-by-Step Data Migration Guide
The migration process can be broken down into three main phases:
A. SAP HANA → BigQuery (ETL/ELT Pipeline)
This stage of the data migration guide focuses on extracting, transforming, and loading data from SAP HANA to BigQuery.
- Connectivity Setup
- Tools: SAP Data Services, SAP SDI, Apache NiFi, Google Dataflow/Composer
- Establish connections using direct JDBC/ODBC connectors or scheduled batch processes.
- ETL/ELT Design
- Extract: Identify the necessary source tables (transactions, master data, etc.).
- Transform: Clean, standardize data types, deduplicate, and normalize the data.
- Load: Transfer data to BigQuery, first to a staging area, then to production, with partitioning & clustering for optimization.
- Recommended Tools
- Google Cloud Dataflow: For both streaming and batch ETL processes.
- Cloud Composer: To orchestrate workflows.
- Third-party tools: Fivetran, Talend, and Informatica for low-code data connectivity.
B. BigQuery Data Modeling
This step of the data migration guide involves preparing your BigQuery environment for efficient querying.
- Schema Design
- Implement star or snowflake schemas, using fact and dimension tables.
- Incorporate Slowly Changing Dimensions (SCD) to manage historical data.
- Governance & Metadata
- Define and enforce naming conventions, data types, and catalog entries.
- Utilize BigQuery Data Catalog for efficient data search and discovery.
- Security Setup
- Implement Row-Level Security (RLS) for data segmentation, especially in multi-region deployments.
- Manage access control through Google Cloud Identity and Access Management (IAM).
C. BigQuery → Power BI Integration
This phase focuses on connecting BigQuery to Power BI for data visualization and reporting.
- Setup
- Use the native BigQuery connector in Power BI Desktop.
- Choose between Import mode (faster performance with scheduled refreshes) and DirectQuery mode (real-time data access).
- Modeling
- Define relationships between tables and remove unnecessary fields.
- Optimize the data model to reduce cardinality and improve performance.
- Visualization
- Develop interactive dashboards using:
- Drill-downs, tooltips, and bookmarks for enhanced navigation.
- KPI cards, slicers, filters, and cross-highlighting for data exploration.
- Performance Boosts
- Use materialized views or create aggregated tables within BigQuery to improve query performance.
- Reduce refresh load by implementing data caching or using the import mode strategically.
Testing & Validation
Thorough testing is vital in any data migration guide.
- Data Integrity: Verify data accuracy by comparing row counts, sums, and key performance indicators (KPIs) with the original Tableau reports.
- Performance: Evaluate loading times and resource utilization in both the old and new systems.
- User Acceptance Testing (UAT): Involve business users early in the process to validate the behavior and usability of the new dashboards and reports.
Training & Documentation
Proper training and documentation are essential for smooth adoption and ongoing maintenance for data migration.
Training:
Provide training to your teams on:
- Power BI reporting, interactivity, and sharing capabilities.
- BigQuery SQL usage and dataset structure.
Documentation:
Create comprehensive internal documentation for:
- Data pipeline processes.
- Data refresh schedules.
- Data access policies.
Maintenance & Monitoring
Establish processes for ongoing maintenance and monitoring to ensure the long-term health of your data analytics platform.
- BigQuery: Set up cost alerts, schedule queries for regular data checks, and monitor usage metrics.
- Power BI: Monitor refresh failures, optimize data models regularly, and keep the Power BI environment organized.
- Version Control: Implement version control and change tracking for all pipeline jobs to manage updates and rollbacks effectively.
Wrap-Up
Migrating from SAP HANA and Tableau to BigQuery and Power BI offers a more agile, cloud-native ecosystem that can significantly reduce costs while enhancing scalability and performance. Organizations that make this transition typically experience:
- 30–50% cost reduction (compared to Tableau)
- 2–3× faster reporting times
- Increased team autonomy through better tools and training
By following this step-by-step guide, you can ensure a smooth and successful migration to a modern data analytics stack.